
"Anime is an important part of our culture!" ~ Ryota Mitarai from Danganronpa 3: The End of Hope's Peak High School
Indeed it is, Ryota. Indeed it is.
Anime, a term derived from the Japanese abbreviation of “animation,” has become a significant part of global popular culture in recent decades. Its relevance in today’s culture can be attributed to several factors, including its unique art style, diverse storytelling techniques, and the ability to explore complex themes.
Anime’s storytelling techniques are diverse and span a wide range of genres and themes. Perhaps you’ve even heard of a few shows from your favorite genre! From action-packed shonen series like “Dragon Ball” and “Naruto” to emotional dramas like “Your Lie in April” and “Clannad,” there is an anime for everyone out there! Anime also explores genres beyond traditional boundaries, such as psychological thrillers (“Death Note”), science fiction (“Ghost in the Shell”), and fantasy (“Attack on Titan”).
In recent years, the popularity of anime has skyrocketed, thanks to digital platforms and streaming services like Crunchyroll and HIDIVE making it easily accessible to a global audience. Anime conventions and events draw massive crowds, showcasing the passion and enthusiasm of fans. The influence of anime has permeated various aspects of popular culture, including fashion, music, video games, and even Hollywood adaptations.
With dozens of new series being released each season, it’s no surprise that fans and providers alike often wonder the age-old question: What makes an anime stick? What makes an anime go down in history like absolute titans (no pun intended) like Attack on Titan, Naruto, Bleach, Dragon Ball Z, and more?! And how do we know and keep track of how audiences are receiving this media?
Well, look no further! In comes MyAnimeList.net!
MyAnimeList.net (MAL) is an online platform dedicated to providing a comprehensive database and community-driven hub for anime and manga enthusiasts. Serving as a centralized resource, the website allows users to create personal profiles and maintain detailed lists of anime series, films, and manga they have consumed.
At its core, MyAnimeList.net offers a vast catalog of titles, encompassing a wide range of genres and themes. Users can search and explore the database to discover new anime and manga, while accessing essential information such as synopses, release dates, and production details.
The website also facilitates user engagement through its rating and review system, enabling community members to express their opinions on individual titles. This user-generated content fosters a vibrant environment for critical discourse, as well as the exchange of recommendations and insights.
Data and Data Cleaning
We downloaded three datasets housed on Kaggle scraped between February 26th and March 20th 2020 containing information about 17,562 anime, and the preferences and ratings from 325,772 different users.
The anime dataset, which is the main dataset of interest, detailed the
core information of each anime listed.
We retained the following information from the anime dataset:
| Column | Description |
|---|---|
| MAL_ID | MyAnimelist ID of the anime. Unique for each anime. |
| Name | full name of the anime |
| Score | average score of the anime given from all users in the MyAnimelist database. Score out of 10 pts. |
| Genres | comma separated list of genres for this anime. (e.g. Action, Adventure, Comedy, Drama, etc.) |
| Type | TV, movie, OVA, etc |
| Episodes | number of episodes |
| Aired | broadcast date (e.g. Apr 3, 1998 to Apr 24, 1999) |
| Studios | comma separated list of studios |
| Source | Manga, Light novel, Book, etc. |
| Duration | duration of the anime per episode (e.g. 24 min. per ep.) |
| Rating | age rate (e.g. R - 17+ (violence & profanity)) |
| Ranked | ranking position based on the score (e.g 28)) |
| Popularity | position based on the number of users who have added the anime to their list |
| Members | number of community members that are in this anime’s “group” |
| Favorites | number of users who have the anime in their “favorites” list |
| Watching | number of users who have marked the anime as ‘watching’ |
| Completed | number of users who have marked the anime as ‘completed’ |
| On-Hold | number of users who have marked the anime as ‘on-hold’ |
| Dropped | number of users who have marked the anime as ‘dropped’ |
| Plan to Watch | number of users who have marked the anime as ‘plan to watch’ |
Additionally, we downloaded the anime_with_synopsis and the
rating_complete data. The key information retained in the
anime_with_synopsis data is the synopsis of each anime as recorded on
the MyAnimeList.net site.
We left-joined the anime data with the anime_with_synopsis data to
retain synopsis information on all anime that had synopsis information
in the anime dataset.
The rating_complete data only considers anime ratings that users have
marked as ‘completed’ on the platform. It gives the user_id,
anime_id as it corresponds to the MyAnimeList ID of the anime the user
has rated, and the rating (or score out of 10) being the rating that
the user has assigned to that particular anime that they have marked as
completed. In order to synthesize this information, we aggregated the
data by anime ID and derived the average score given to each anime by
users that have marked that anime as completed. This information was
also left-joined to the dataset with the original anime data and
synopsis data in order to retain the average score of each anime as
according to users that have marked the anime as completed.
Thus, we add two more columns of interest in our dataset.
| Column | Description |
|---|---|
| Synopsis | string with the synopsis of the anime |
| Score_completed | average score of the anime given from users that have marked the anime as ‘completed’ in the MyAnimelist database. Score out of 10 pts. |
I first chose to reduce our analysis to only include anime with more
than one episode, so that removed a lot of movies, one-shots, and
distinctive OVAs from the dataset. We wanted to get information about
anime series with continuous behavior, even if it was just for a
two-episode stint. This reduced our pool to 9,181 anime. Additionally,
the genres, aired, and studios variables were reformatted for the
purpose of analysis. *Note: For genre, we retained information about
genres that had a frequency of at least 2% of all the genres listed in
the dataset. This reformatting led to the addition of a few more columns
to improve the interpretability of analysis:
| Column | Description |
|---|---|
| Multiple Indicator Genre Variables | indicator (0/1) variables for genres Action, Adventure, Comedy, Drama, Fantasy, Hentai, Historical, Kids, Magic, Mecha, Romance, School, Sci-Fi, Shounen, Slice of Life, Supernatural |
| Start Year | the year the anime started airing |
| End Year | the year the anime ended airing - this value is NA is the anime is currently airing |
| Primary Studio | the first studio listed in the ‘studios’ variable |
| Secondary Studio | the second studio listed in the ‘studios’ variable |
| Number of Studios | the number of studios working/that worked on the anime |
Most data cleaning was conducted using NumPy and pandas in Python
with some final touches conducted using tidyverse and dplyr in R.
The code for data cleaning can be found in the GitHub repository linked
at the top of the page.
Research Questions
There are a few questions that we hope to answer using this dataset.
-
What features are most important to predicting the score of an anime?
-
Do the scores of these anime differ based on all users vs. users that have that anime marked as completed in MAL?
-
Is there an optimal number of episodes an anime should be in order to score well on MyAnimeList?
-
Can the synopsis of an anime be a good indicator of anime ranking?
Before we start to answer our questions of interest, we’ll observe and take note of the distribution of our main dependent variable of interest: anime score. To recall, score is the average score of the anime given from all users in the MyAnimelist database. The lowest score that a user can give an anime is 1 and the highest score a user can give an anime is 10.
And so we observe the distribution of scores we have in our data:
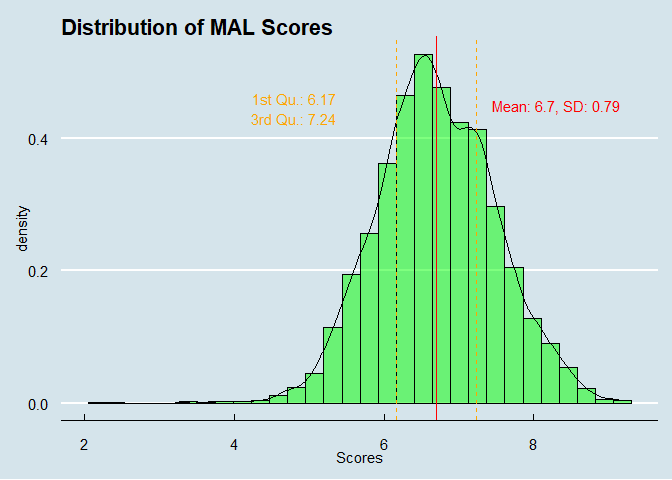
Overall, we have a mean score of 6.7 with 25% of scores lying below 6.17 and 25% of scores lying above 7.24. And so it seems that most of our scores are tightly distributed around our mean of 6.7. We do observe some left skew but it seems that skew is mainly due to a few outliers.
The Pinnacle of Anime: What are the most important contributors to predicting the popularity (score) of an anime?
We start by checking for multicollinearity between our predictors of
interest in order to reduce dimensionality and stabilize the variance of
our estimated coefficients. Because of their direct relationship with
the dependent variable of interest (score), we omit ranked,
popularity, and score_completed as possible predictors.
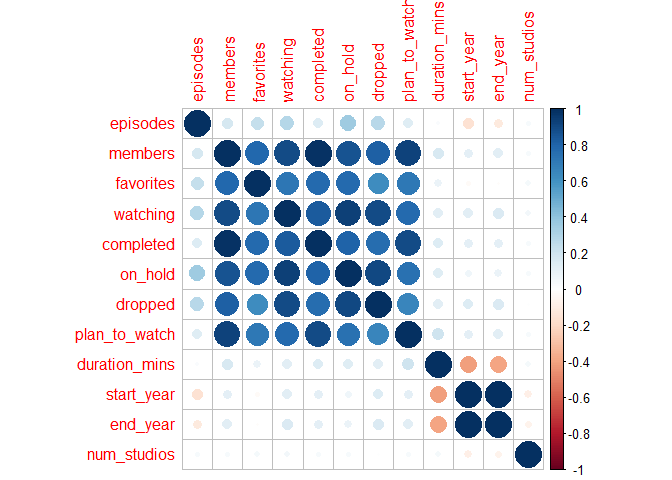
Notably, number of members, favorites, watching, completed,
on-hold, dropped, and plan to watch are moderately to highly
correlated with one another. In order to correct for this, we will
retain number of community members in each anime’s group as the
representation of membership to the anime’s fan base in our dataset.
Additionally, start year is highly correlated with end year so we just
retained information on start year and instead created a variable
representing number of years running.
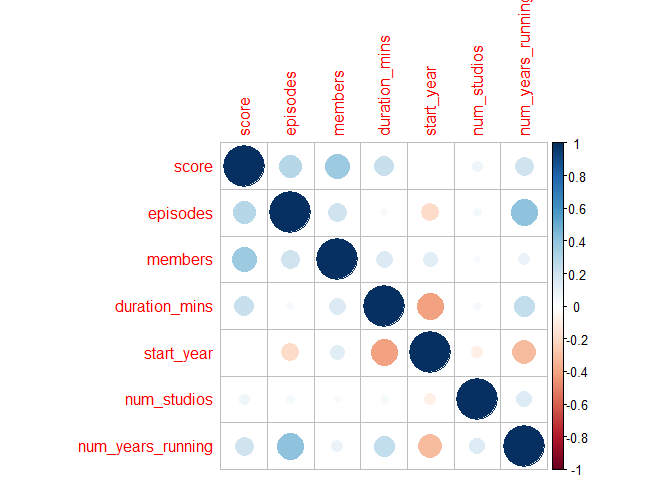
After removing the variables strongly correlated with number of members, we have a better distribution of variables without unexpected multicollinearity. We move on to stepwise selection with these predictors as well as our non-numeric predictors to choose the best variables to model MyAnimeList score.
To recall, we retain the following variables as the subset of predictors to choose from: type, number of episodes, primary studio, secondary studio, source, rating, number of members in that anime’s community, duration in minutes per episode, airing start year, number of animation studios working on the anime, and binary/indication variables for the following variables: Action, Adventure, Comedy, Drama, Fantasy, Historical, Kids, Magic, Mecha, Romance, School, Sci-Fi, Shounen, Slice of Life, and Supernatural.
In order to validate the generalizability of our model, we will perform stepwise selection on 80% of our dataset, which we’ll call the training data. The remaining 20% will be saved to test (test data) the accuracy of our model on.
After going through stepwise selection, we yield the following model:

where E[Score] is the expected value of the score of each anime.
##
## Call:
## lm(formula = score ~ episodes + rating + members + duration_mins +
##     action + comedy + drama + historical + magic + school + shounen +
##     slice_of_life + start_year + num_years_running, data = train)
##
## Residuals:
##     Min      1Q  Median      3Q     Max
## -3.5290 -0.3887  0.0254  0.4292  1.8228
##
## Coefficients:
##                                        Estimate Std. Error t value Pr(>|t|)
## (Intercept)                          -1.435e+01  1.973e+00  -7.271 4.10e-13 ***
## episodes                              3.973e-04  1.832e-04   2.169 0.030137 *
## ratingPG-13 - Teens 13 or older       1.581e-01  3.079e-02   5.134 2.95e-07 ***
## ratingPG - Children                   5.012e-02  4.447e-02   1.127 0.259768
## ratingR - 17+ (violence & profanity)  2.186e-01  4.212e-02   5.190 2.19e-07 ***
## ratingR+ - Mild Nudity               -1.615e-01  4.207e-02  -3.838 0.000126 ***
## ratingRx - Hentai                    -2.056e-01  4.048e-02  -5.078 3.95e-07 ***
## members                               1.348e-06  5.028e-08  26.804  < 2e-16 ***
## duration_mins                         1.640e-02  1.064e-03  15.421  < 2e-16 ***
## action1                               1.615e-02  2.269e-02   0.712 0.476548
## comedy1                               1.481e-01  2.062e-02   7.184 7.77e-13 ***
## drama1                                3.114e-01  2.488e-02  12.514  < 2e-16 ***
## historical1                           2.626e-01  3.652e-02   7.190 7.43e-13 ***
## magic1                                6.428e-02  3.200e-02   2.009 0.044598 *
## school1                               3.519e-02  2.608e-02   1.349 0.177276
## shounen1                              2.779e-01  2.476e-02  11.224  < 2e-16 ***
## slice_of_life1                        2.273e-01  2.836e-02   8.015 1.36e-15 ***
## start_year                            1.011e-02  9.820e-04  10.298  < 2e-16 ***
## num_years_running                     3.291e-02  9.432e-03   3.489 0.000489 ***
## ---
## Signif. codes:  0 '***' 0.001 '**' 0.01 '*' 0.05 '.' 0.1 ' ' 1
##
## Residual standard error: 0.6343 on 5078 degrees of freedom
##   (2247 observations deleted due to missingness)
## Multiple R-squared:  0.3634, Adjusted R-squared:  0.3612
## F-statistic: 161.1 on 18 and 5078 DF,  p-value: < 2.2e-16
So, what does this tell us? A few things actually. Among the anime in our training data, the more episodes that an anime has, the more likely it is to be scored highly on MAL. With each new additional episode in an anime, we expect a 0.0004 increase in score.
In regard to content ratings, we list the rating labels in order of highest to lowest scored, holding all other variables in our model constant:
-
R - 17+ (violence & profanity)
-
PG-13 - Teens 13 or older
-
PG - Children
-
G - All Ages
-
R+ - Mild Nudity
-
Rx - Hentai
Notably, there doesn’t seem to be a linear relationship between rating and score. While generally audiences tend to like content that are on the maturer side (rated PG-13 and R - 17+), there’s a limit to exactly how spicy audiences like their content to be cooked up for them. Particularly, as we see an upward trend in score from ratings G, PG, PG-13, and R- 17+, the next two more intense levels of content, R+ for mild nudity and Rx for full blown Hentai, are in fact scored the lowest on the list. Meaning, mature themes seem to be a hit among the MAL community, but explicit content… not so much.

As expected, number of members in that anime’s MAL group is positively associated with that anime’s score. For every one additional member, we expect a 0.000001 increase in score, holding all other variables in the model constant. While this change seems small, it’s helpful to keep in mind the range of values in each anime’s group.
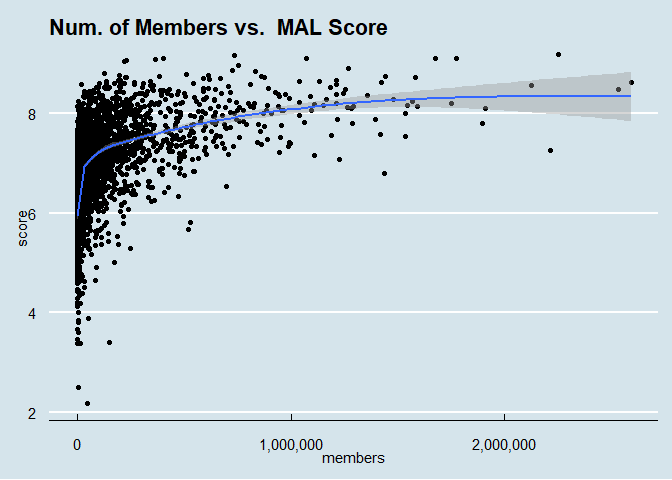
In our train dataset, the number of members within each anime’s group ranges from 1 to 2,589,552 with a median value of 4,568 which is a huge range! This means, for example, we expect the score of an anime with a member base the size of the median value of 4,568 to increase by an estimated 0.005 (0.000001*4,568 members) points.
Now let’s talk duration per episode. Our model shows that there is a positive association between the duration of episodes, and the score of an anime. The longer the anime, the deeper the obsession. With each additional minute per episode, the score is expected to increase by 0.02. Of course, the expectation of duration is different by type (e.g. TV, Movie, OVA).
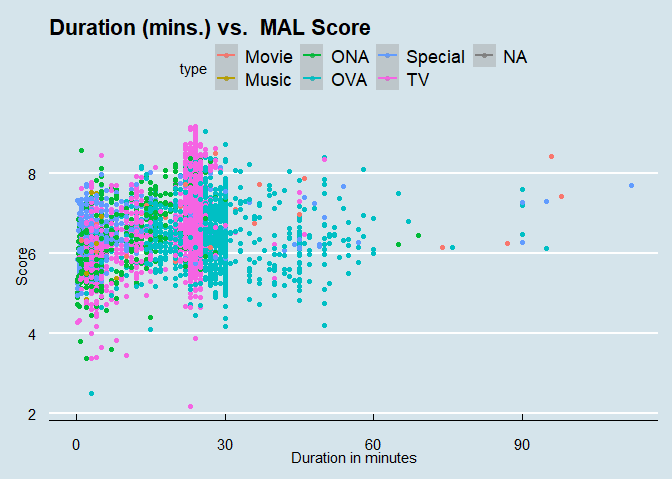
Though, there’s no hard and fast rules for how long these mediums can be, we see from the scatterplot above that while anime for TV typically tend to keep within 30 minutes or less, mediums like OVAs are more variable in their length (see scatterplot above). Additionally, specials, music videos, and ONAs tend to be shorter and movies tend to be longer.
How about genre? Do some genres tend to be more well received than others, at least in regard to score?
Well, according to our model, these are the genres that are scored from highest to lowest on MyAnimeList.net, holding all other variables in our model constant:
-
Drama
-
Historical
-
Shounen
-
Slice of Life
-
Comedy
-
Magic
-
School
-
Action
Now, you may be wondering, how come Action isn’t ranked higher on this list?! I mean, from My Hero Academia to Jujutsu Kaisen, it’s no doubt that Action anime encompass a huge portion of the hits right now. However, action is also the most frequently reported genre in 2020. So while it’s a standout among the hits, in the grand scheme of things, while there are amazing Action anime that are being ranked and perceived well, there are also Action anime out there that are performing less favorably among crowds. In fact, it seems that the Action genre may even be over-saturated with the good, the bad, and the ugly. In other words, purely slapping the genre of Action on your anime doesn’t make it an automatic hit. Yes, it’s true. Audiences won’t just froth at the mouth at characters going toe-to-toe in combat without the plot having that special ‘oomph’ to it that really would make it a generational favorite.
This just in, newer anime are in! According to our model, with each additional year of an anime airing, we expect a score increase of 0.01. Of course, this may just be a consequence of recency bias and how anime are often more likely to be popular and perceived well in their prime (i.e. when they’re still airing and fresh off the presses). But it’s interesting to think how year-to-year advancements in animation and technology may have contributed to the perception of newer anime.
Additionally, we can take into account how many years an anime has been running. Evidently, anime that have been on-going for longer have significantly higher scores than those that have not. Perhaps being in the good graces of key audiences is what have allowed them to persist for so long. According to our model, with each additional year of run time, the score value is expected to increase by 0.03.
Now that we’ve summarized what our model is trying to tell us about the anime in our training set, we can apply our model to our withheld test set to see how well it performs on data it hasn’t seen!
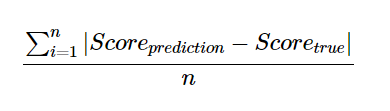
We’ll use mean absolute error (MAE) as our measure of score prediction error, which is measured as such:
We use our model to predict on our test data and collect prediction error on each observation. The plot below shows that the distribution of prediction error seems to roughly normally distributed with a maximum error observed of 2.64 and a minimum error of -1.79. To put things into context, on a scale of 1-10, which is the scale of MAL score, an error of 2.64 can be a gross overestimation of an anime’s score. This maximum value seems to be an outlier though as the majority of prediction errors hover around 0.
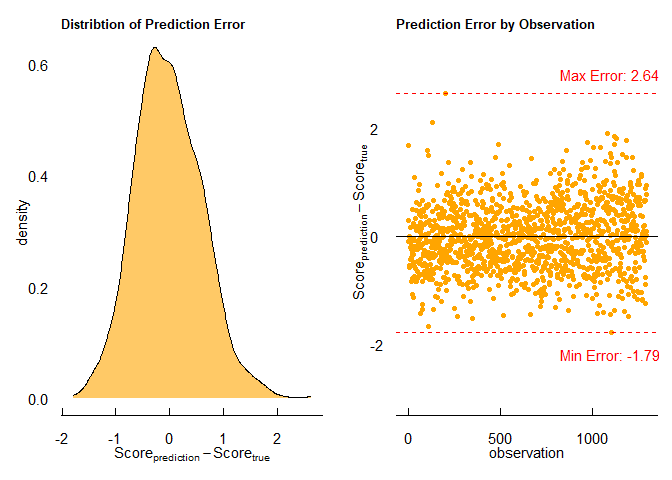
And so the mean absolute error is 0.5. So, on average, we can expect a 0.5 (or 1/2 a point) prediction error from this model. With that being said, it may be reasonable to conclude that our model generally performs well on our test data and we may have some comfort in the validity of the inferential conclusions drawn by our model!
Scores Galore: Do users preemptively score anime? Does the general consensus change from all users to users who have marked anime as ‘completed’?
Alright! We’ve talked about the key predictors of anime performance and to what magnitude these factors are expected to affect MAL score. We do well to recall that MAL score is averaged from scores assigned to anime from all users. A question of interest - does this averaged score significantly differ from the average score given only by users that have marked each respective anime as ‘completed’? And if so, could this give us insight that users may preemptively score anime or that users that may score anime before seeing the whole thing may have held a different opinion if they had seen the whole thing through? Let’s investigate.
Earlier, we were able to left-join information on scores given to anime by users that have marked those anime as ‘completed’ on MAL.
In order to test this, we may derive a vector of pairwise differences between the MAL score and the average score given by users that have indicated that they have completed the respective anime:
ScoreMAL - ScoreCompleted
If the scores are not significantly different, we may expect that this vector of differences follow a normal distribution centered around 0.
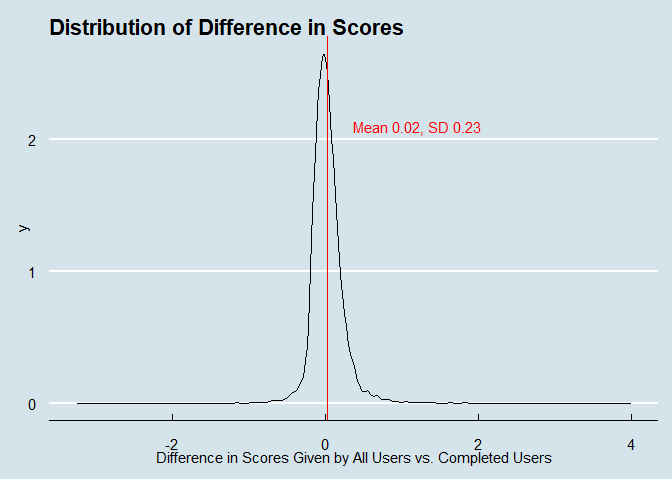
The distribution of differences between scores (MAL Score - Completed Users Score) is centered around a mean of 0.02 with a standard deviation of 0.23. A mean of 0.02 which is positive, means that MAL scores generally tend to be slightly higher than scores given by users who have marked those anime as completed.
It’s difficult to just eyeball this distribution and decide whether or not the differences between these scores are significantly different or not. One way to formally test this is by using a paired-sample t-test. The paired-sample t-test can be used to determine whether the mean difference between pairs of measurements is 0 or not. Thus, the following hypotheses are tested:
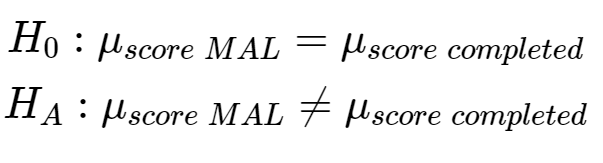
We display the results of the t-test below:
##
##  Paired t-test
##
## data:  anime_full_df$score and anime_full_df$score_comp
## t = 7.8543, df = 6832, p-value = 4.637e-15
## alternative hypothesis: true mean difference is not equal to 0
## 95 percent confidence interval:
##  0.01616230 0.02691326
## sample estimates:
## mean difference
##      0.02153778
The test yielded a p-value of 4.64 * 10-15 which gives us significant evidence to reject the null hypothesis. Thus, we may conclude that the mean difference between the sets of scores is not statistically zero. In particular, it’s possible that generally users are preemptively scoring these anime when they otherwise may have had a worse opinion of the content had they completed the anime. Though, this is just a theory as to why we may be seeing a difference between the scores. We would have to do more extensive research like conducting an experiment or navigating a causal conclusion in order to explain why this phenomenon is observed in the data.
How long is too long?

We’ve all heard the age-old qualm with some anime these days. Though fans alike love it when our favorite story lines and characters keep shoveling quality content into our trying lives, when is enough enough? Die hard fans can all name at least one show where they felt the story was dragged on and on when really, it would’ve just been optimal to end it several episodes or even seasons ago.
So, how long is too long? Is there an optimal range of episodes that an anime should be in in order to leave the audience satisfied?
There are a lot of ways to try and answer this question, but I’m going to do it by means of regressing number of episodes on anime score. Recall that score and episodes are both numeric values. Additionally, we will only consider anime made for TV consumption to keep the anime relatively within the same playing field in terms of episodic behavior instead of also including irregular mediums like movies, specials, and OVAs.
First, we chose to synthesize the number of anime that fall under each episode count. We arbitrarily decided to retain information on episode counts that at least 5 anime fall under so that no one anime is driving our inference on episode count.
After filtering for episodes that have at least 5 episodes under its belt, we get a range of episodes from 3 to 104 episodes.
Thus, we start by averaging MAL score by episode. According to the trend that we observe, there doesn’t seem to be a strong negative or positive relationship between number of episodes and score. Though, what is interesting is where we observe a maximum average score.
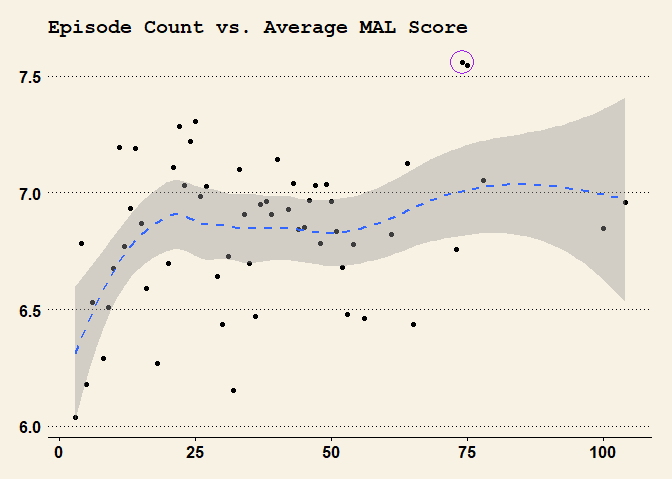
We observe that an episode count of 74-75 episodes yielded the highest MAL scores on average. After 74-75 episodes, the average scores drop back down to below 7.5 out of 10.
Though this isn’t confirmatory that 74-75 is now the magic number, it would be useful to see how this range fairs in MAL datasets from other years as well.
What can synopsis tell us about score?
Included in the MyAnimeList database is a synopsis on the anime. Have you ever wondered if the synopsis of an anime be a good indicator of score? What kinds of words often appear in anime that score highly vs. those that score lowly?
In order to characterize what it means for an anime to score lowly, averagely, or highly, we categorize score into ordered categories. Particularly, we’ll be categorizing score into three separate categories: low, medium, and high. Anime with scores less than 6 were put into the low category, those with scores greater than or equal to 8 were placed into the high category, and all other anime were placed into the medium category.
After categorizing the score variable, we get that only 5.6% of anime fall into the high category on MAL, 18% of anime fall into the low category, and the remaining 76.4% of anime fall into the medium category.
We collect the synopses from this anime belonging to each score group (low, medium, high) and concatenate/collapse them together.
In order to get meaningful analyses, we will remove stop words from the synopses using the Snowball stop word list. We’ll also add the words ‘source’, ‘ann’, ;anime’, and ‘series’ to the stop words list because they aren’t of contextual significance and often appear in MAL synopses. We check the frequency of the words that appear within synopses of lowly scored, medium scored, and highly scored anime on MAL. We retain information on the top 20 most frequent words that appear in each categorization of score. In order to scope out the most meaningful words, we will remove words that appear in all three of the top 30 lists for anime rated low, medium, and high. These words were one, world, school, new, life, however, high, two, can, day, time, now, and young.
And so we’re left with the following information -
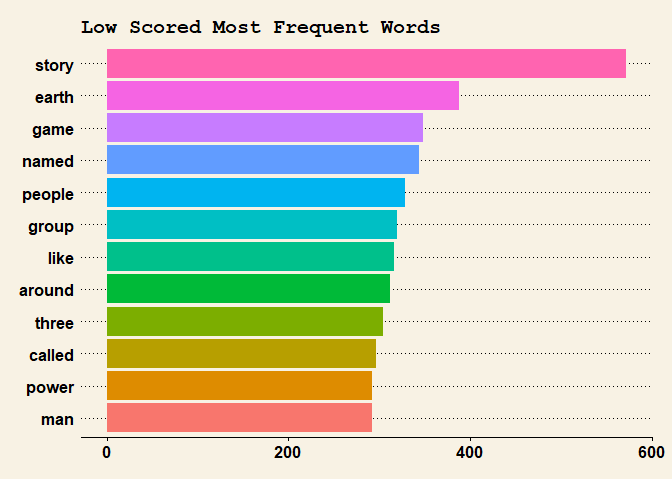
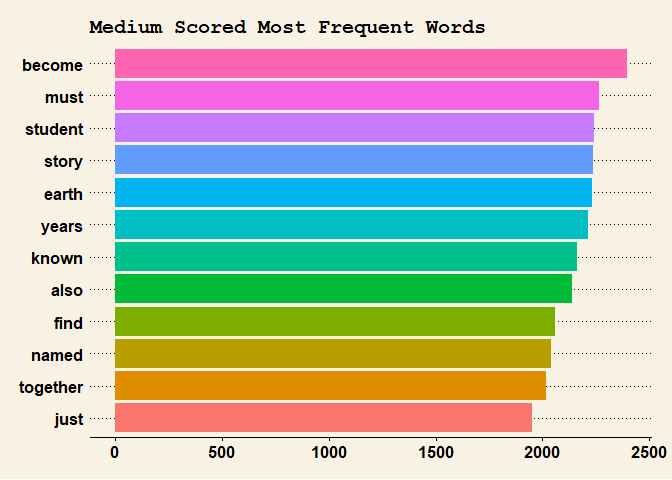
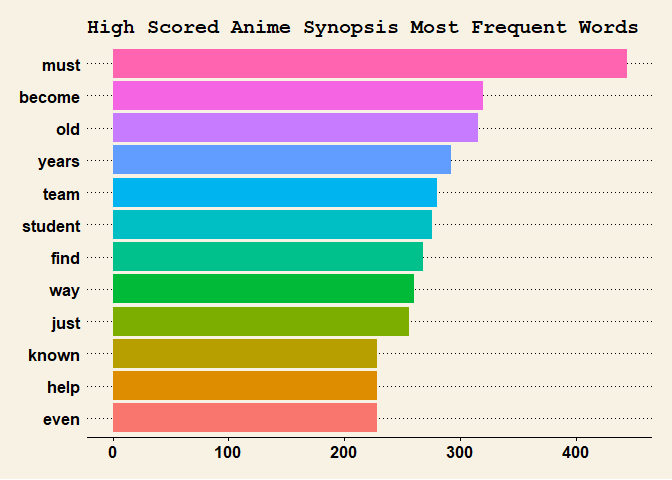
A few things of note, anime involving a girl or girls tend to be
more popular as these words appear most frequently for medium and highly
scored anime synopses but not in lowly scored anime. Anime involving
friends can be found in both highly scored anime and lowly scored
anime so it seems the power of friendship is not too polarizing one way
or the other. The same thing goes for the words year and become.
Interestingly, must, and old standout within anime lowly scored.
Just a few of many observations to take away from this exercise.

For next steps, we can look into adjusting for the number of words in each synopsis or even extending our synopsis analysis into sentiment analysis.
What did we learn?
This blog post discussed the significance of anime in global popular culture and introduced MyAnimeList.net as a platform for anime enthusiasts. The post then presented the findings of a research study conducted using the platform’s 2020 dataset to answer several key questions.
Alright, so the study set out to crack the code on what makes an anime super popular. And guess what? The number of episodes actually matters! Yeah, the longer the series, the higher the rating. It’s like the anime world is telling us, “Give me more!” But hey, it’s not just the length that counts. The type of content makes a difference too. Mature themes? Yeah, they’re cool. But explicit stuff? Not so much. Gotta keep it classy.
Now let’s talk genres. Drama, historical, shounen, and slice-of-life? They’re the kings! They get all the love and high scores. But action, well, it’s a bit overcrowded. It’s like trying to find a diamond in a pile of rocks. Some shine, but others… not so much. Here’s an interesting tidbit: people can be quick to judge. The study found that some users seem to rate anime before even finishing them. It’s like saying, “I’ve seen enough, time to rate!” But hey, completionists, don’t fret. Your scores are a tad more critical than the impatient ones.
Now, you’d think there’s an ideal number of episodes for an anime to be a hit. Well, not necessarily. The study checked out TV anime and surprise, surprise — there’s no magic number. Each series does its own thing, with different episode counts and corresponding scores.
So, there you have it — some preliminary insights into what makes anime popular. We’ve unveiled the secrets of episode length, content, genres, fanbase size, and even impatient raters. Now go forth, my fellow otakus, armed with this quirky knowledge, and let the anime marathon continue!